Tangere

Data Visualization on Tablets

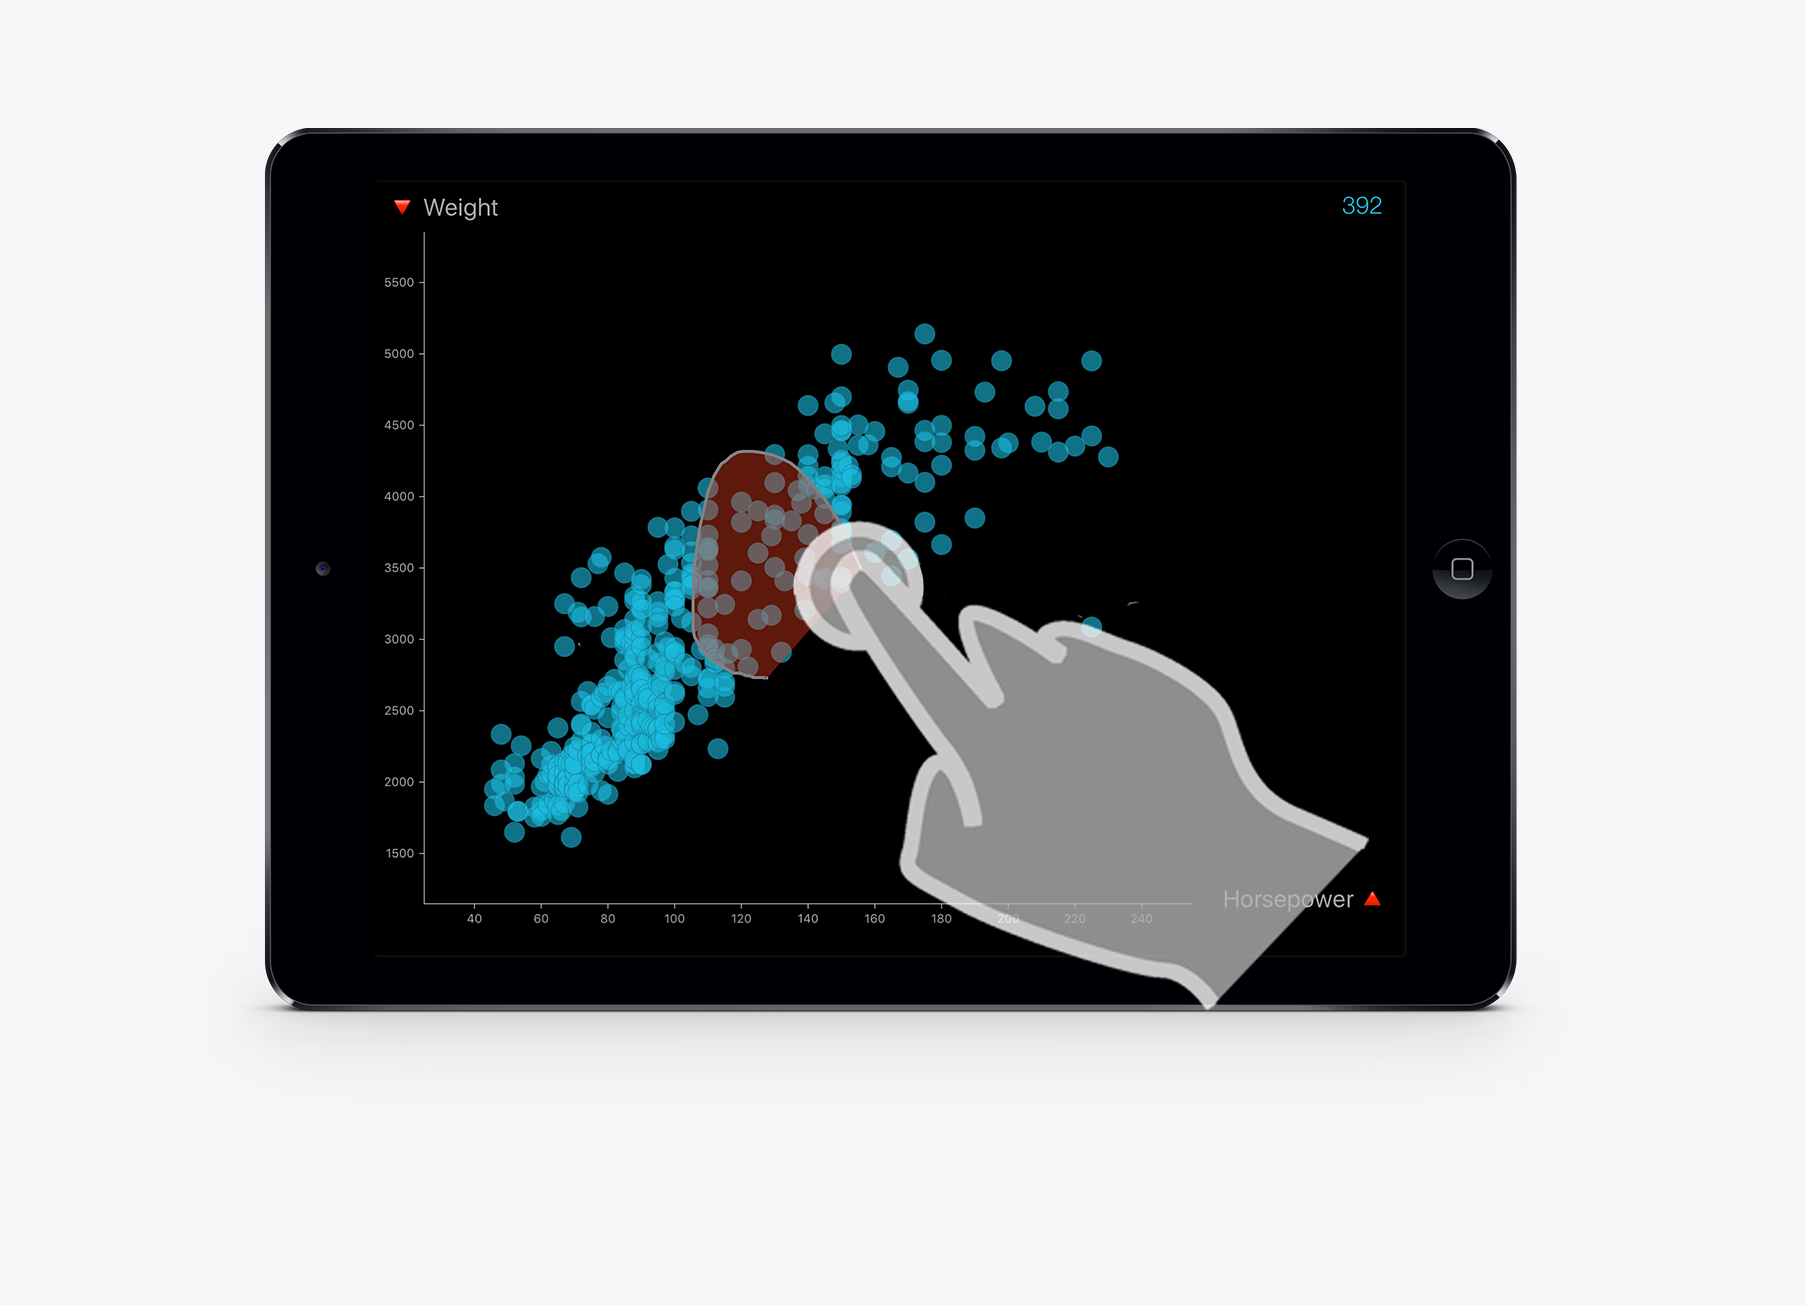
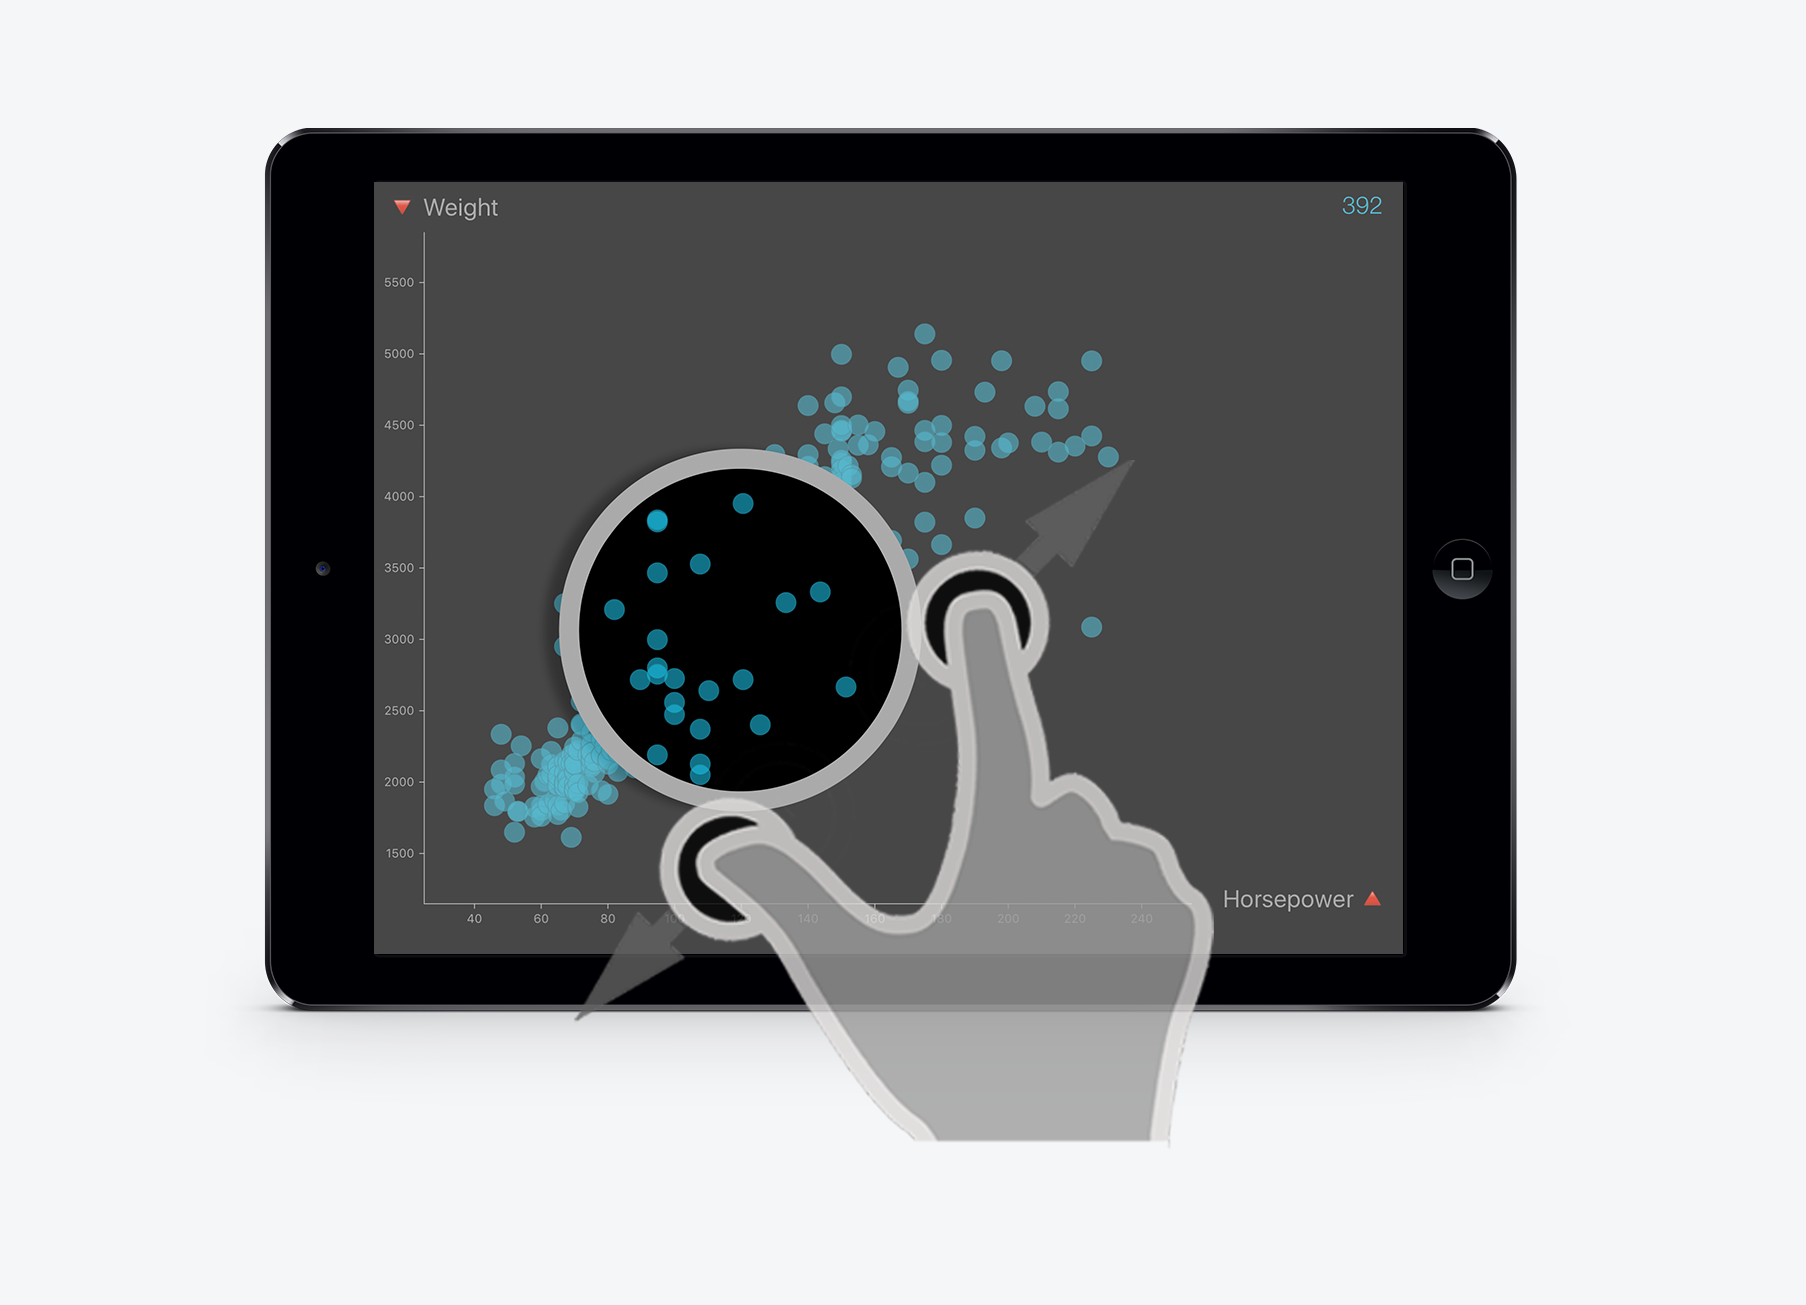
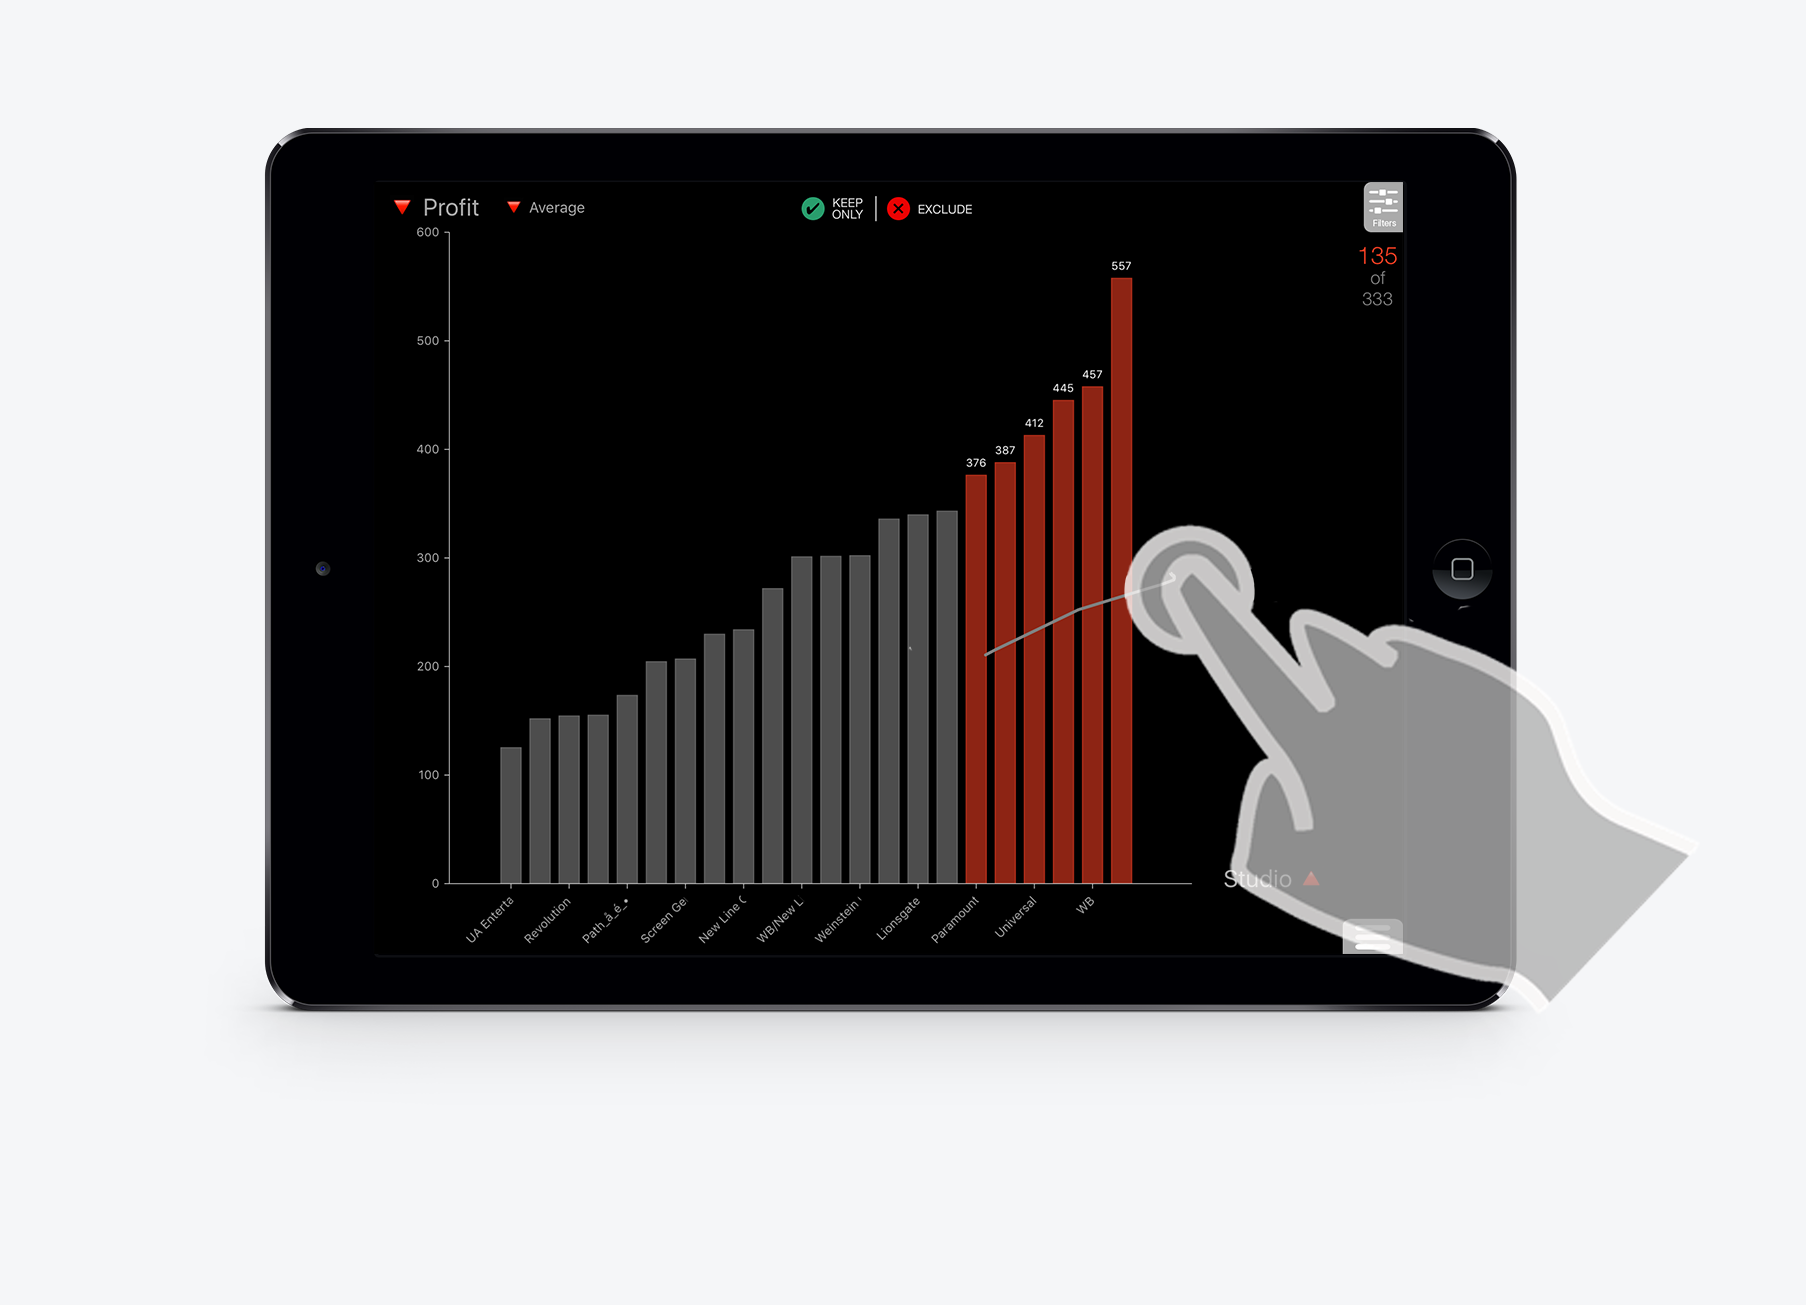
How do visualization techniques adapt to touch-based, cursor-less interfaces? Does touch input increase efficiency or affect how we understand data with visualizations?
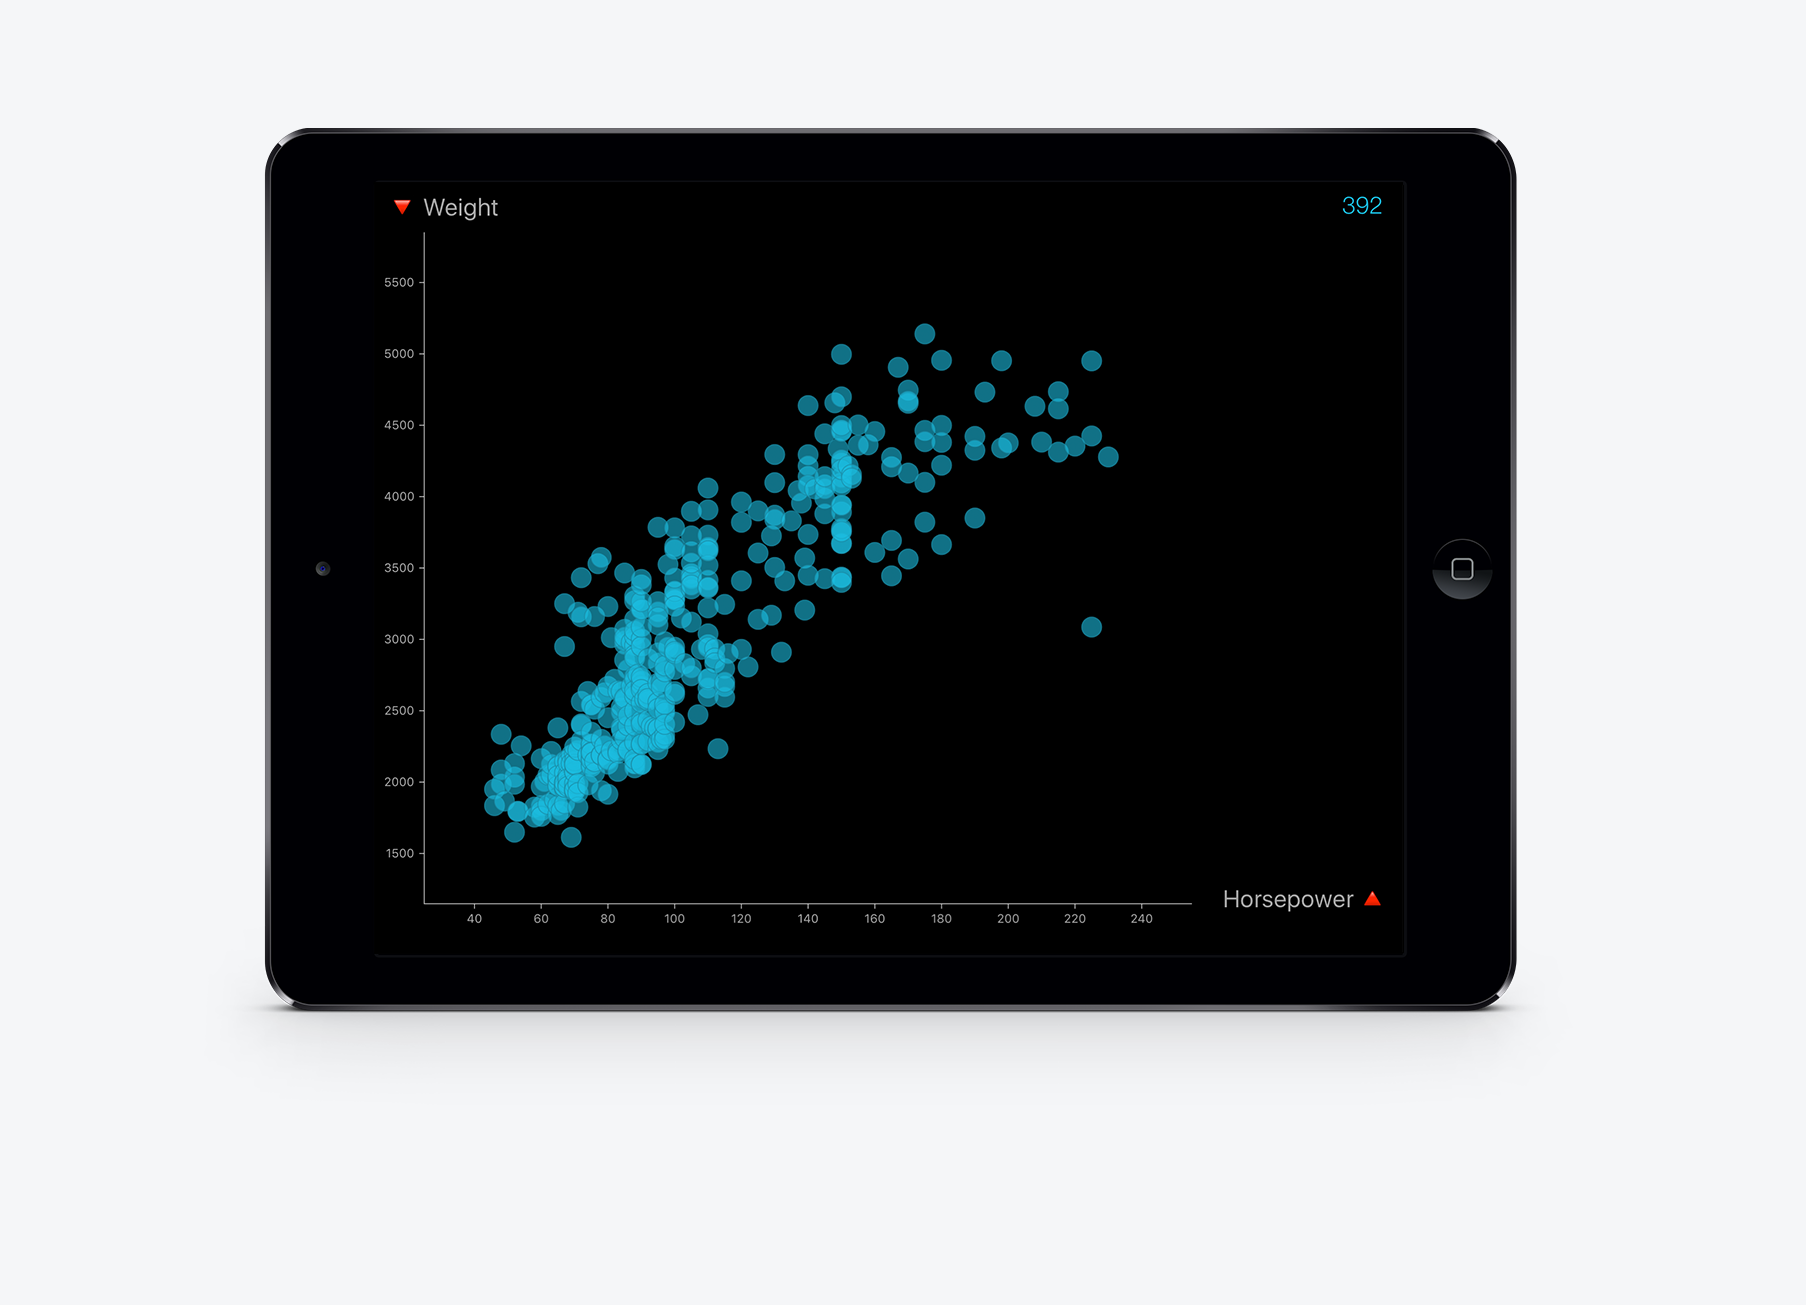
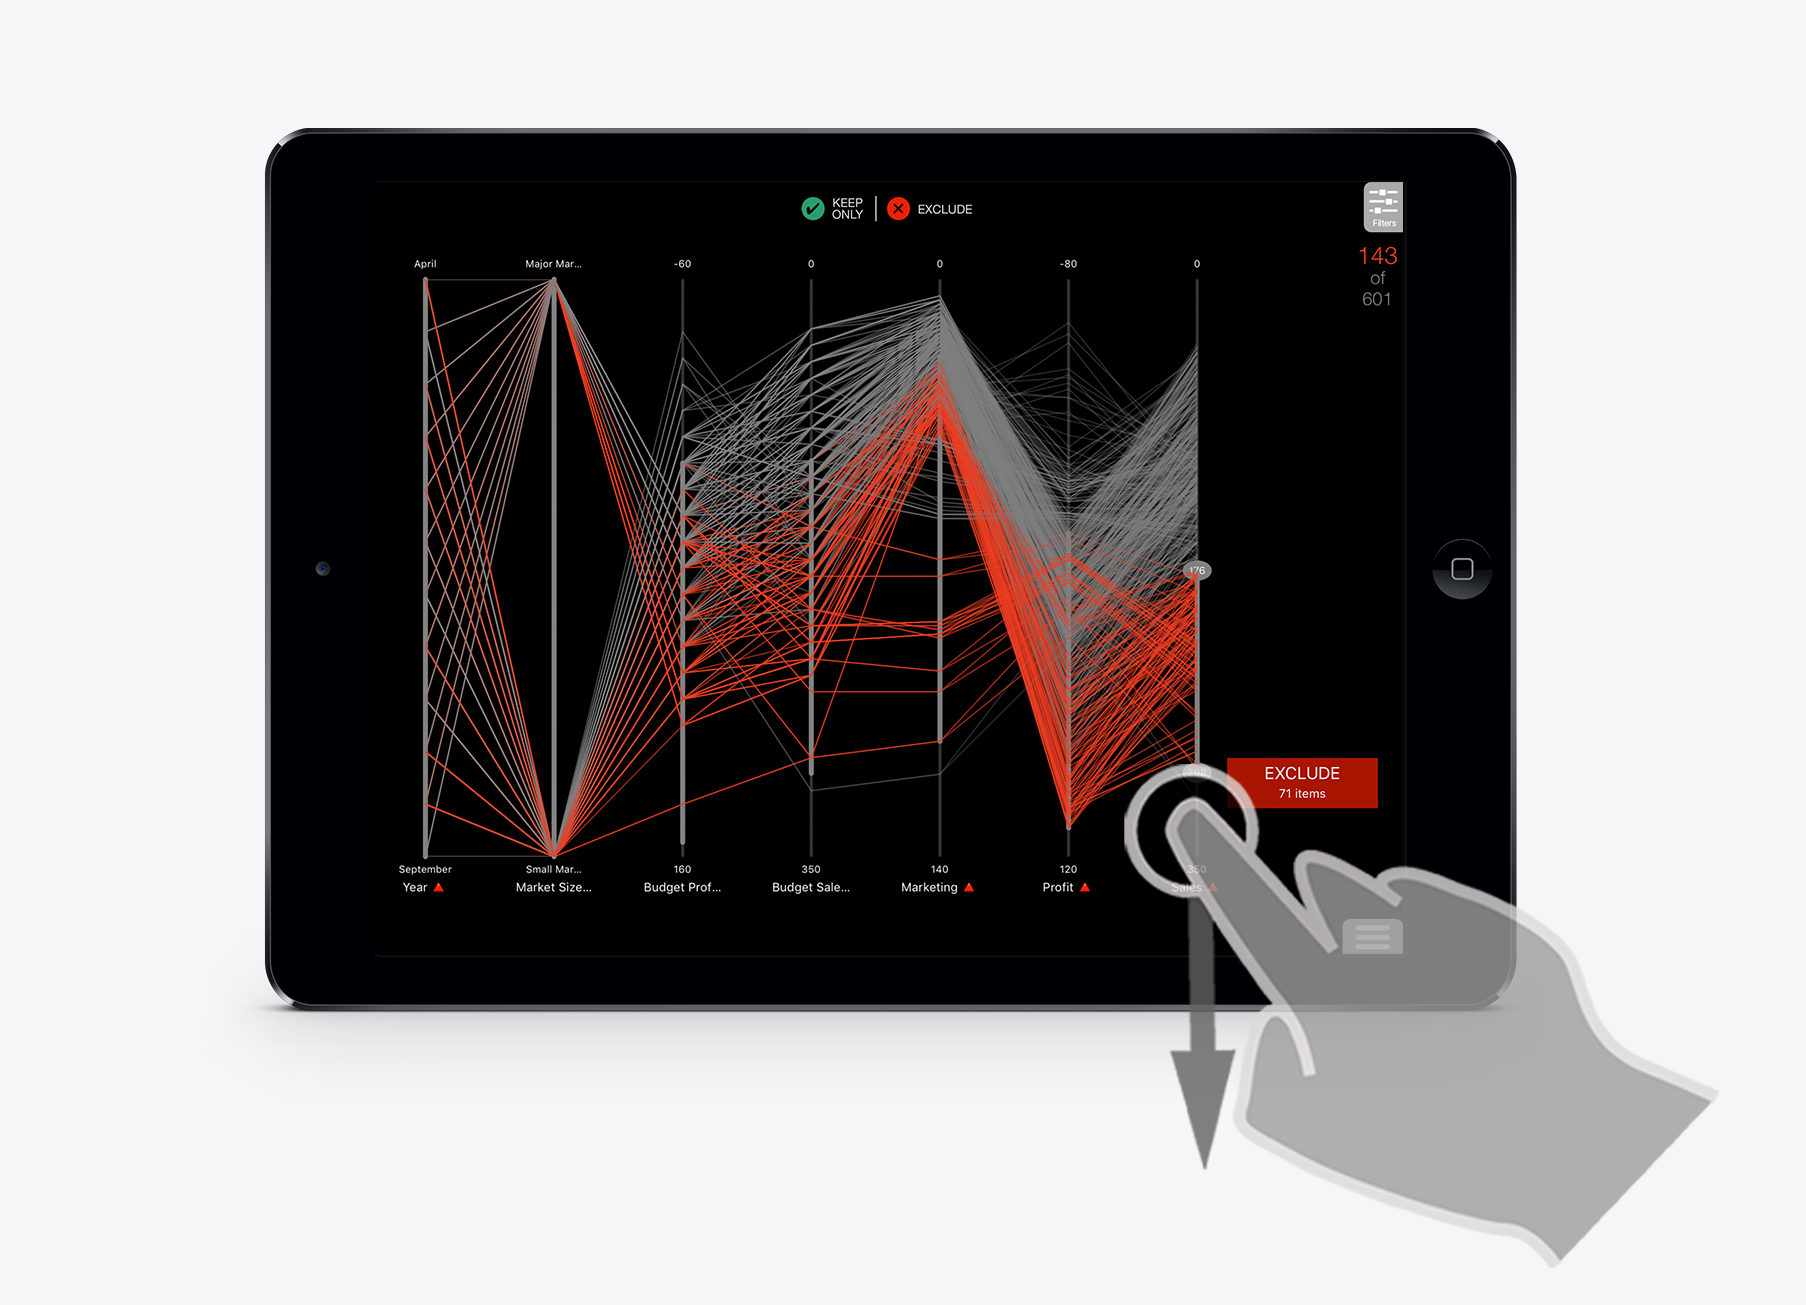
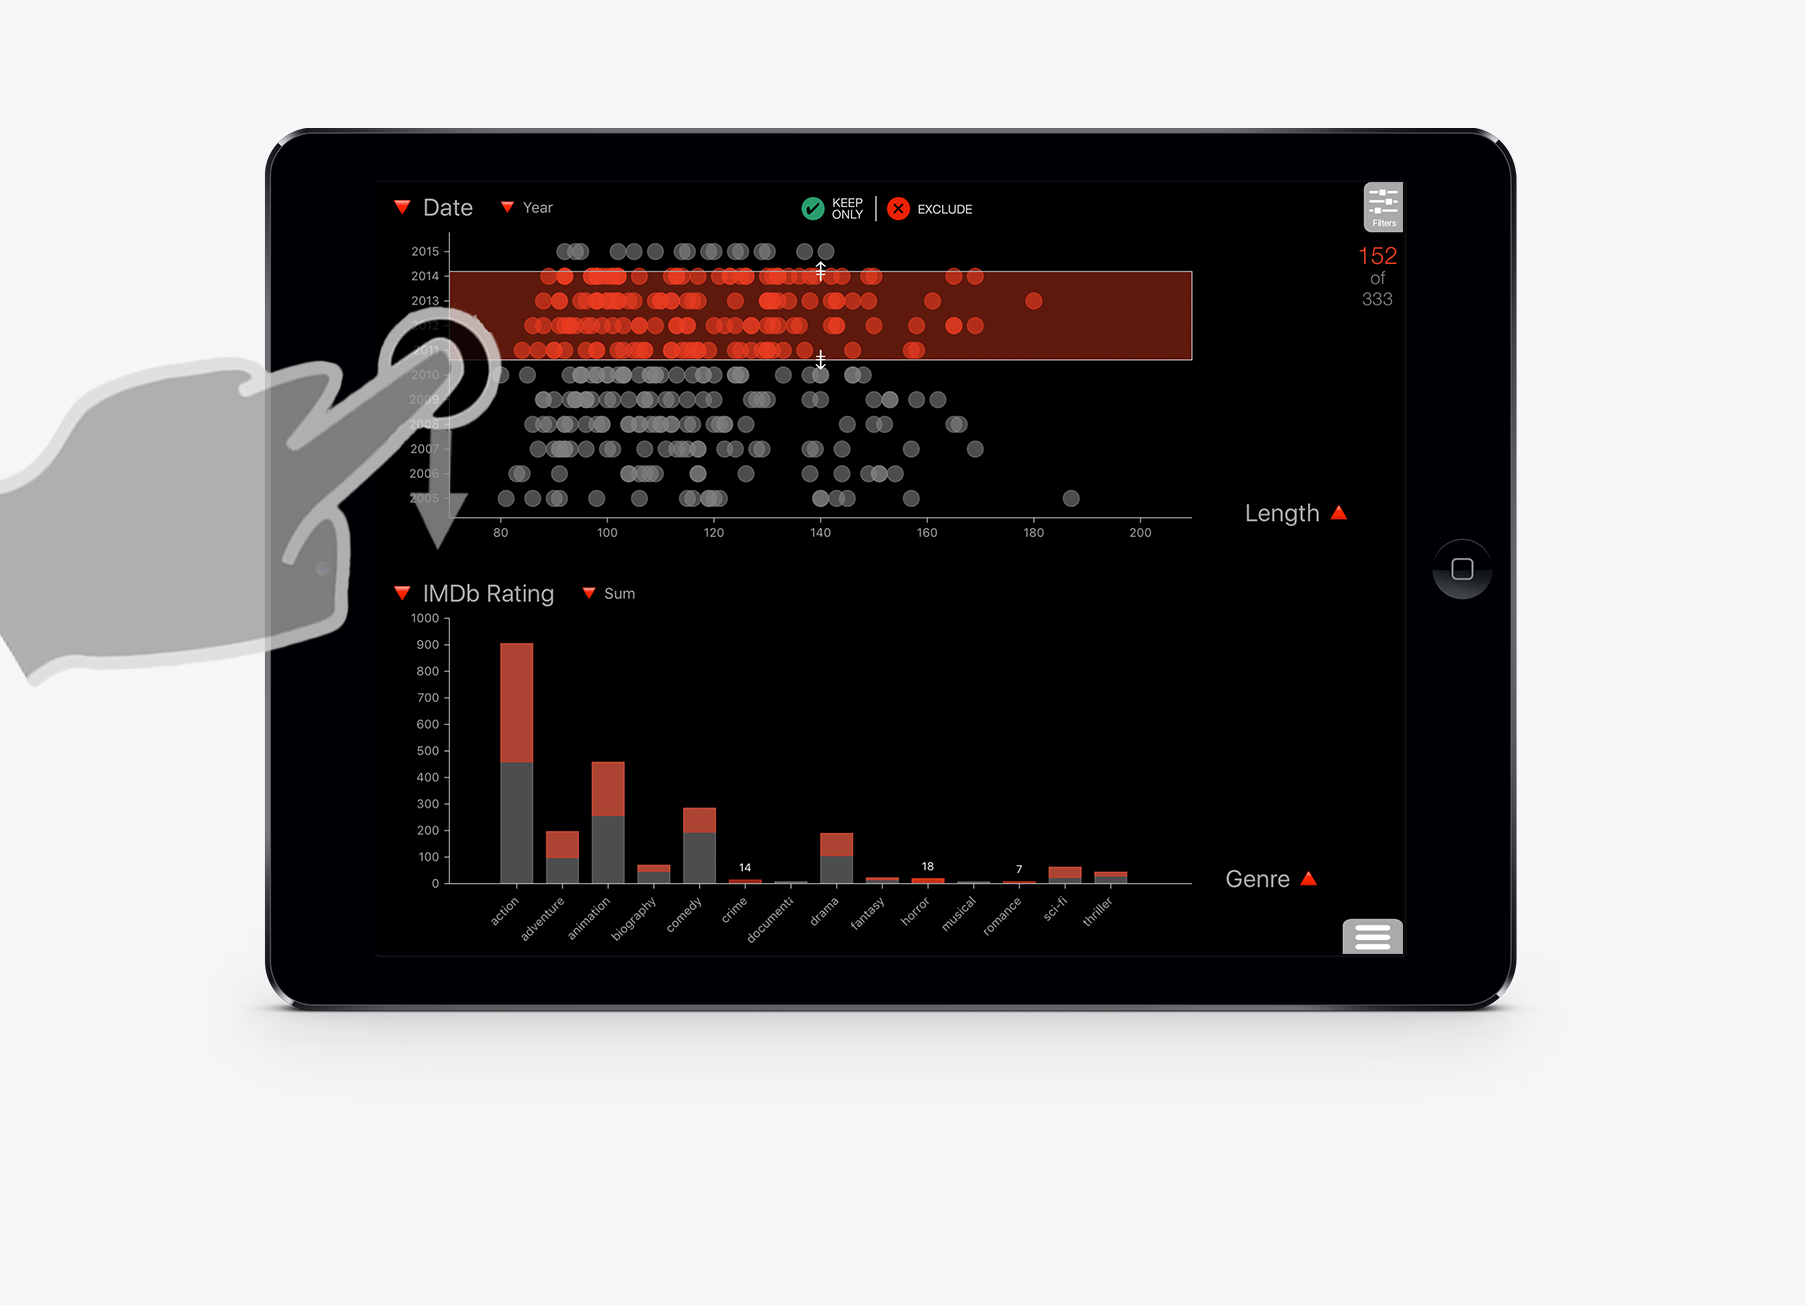
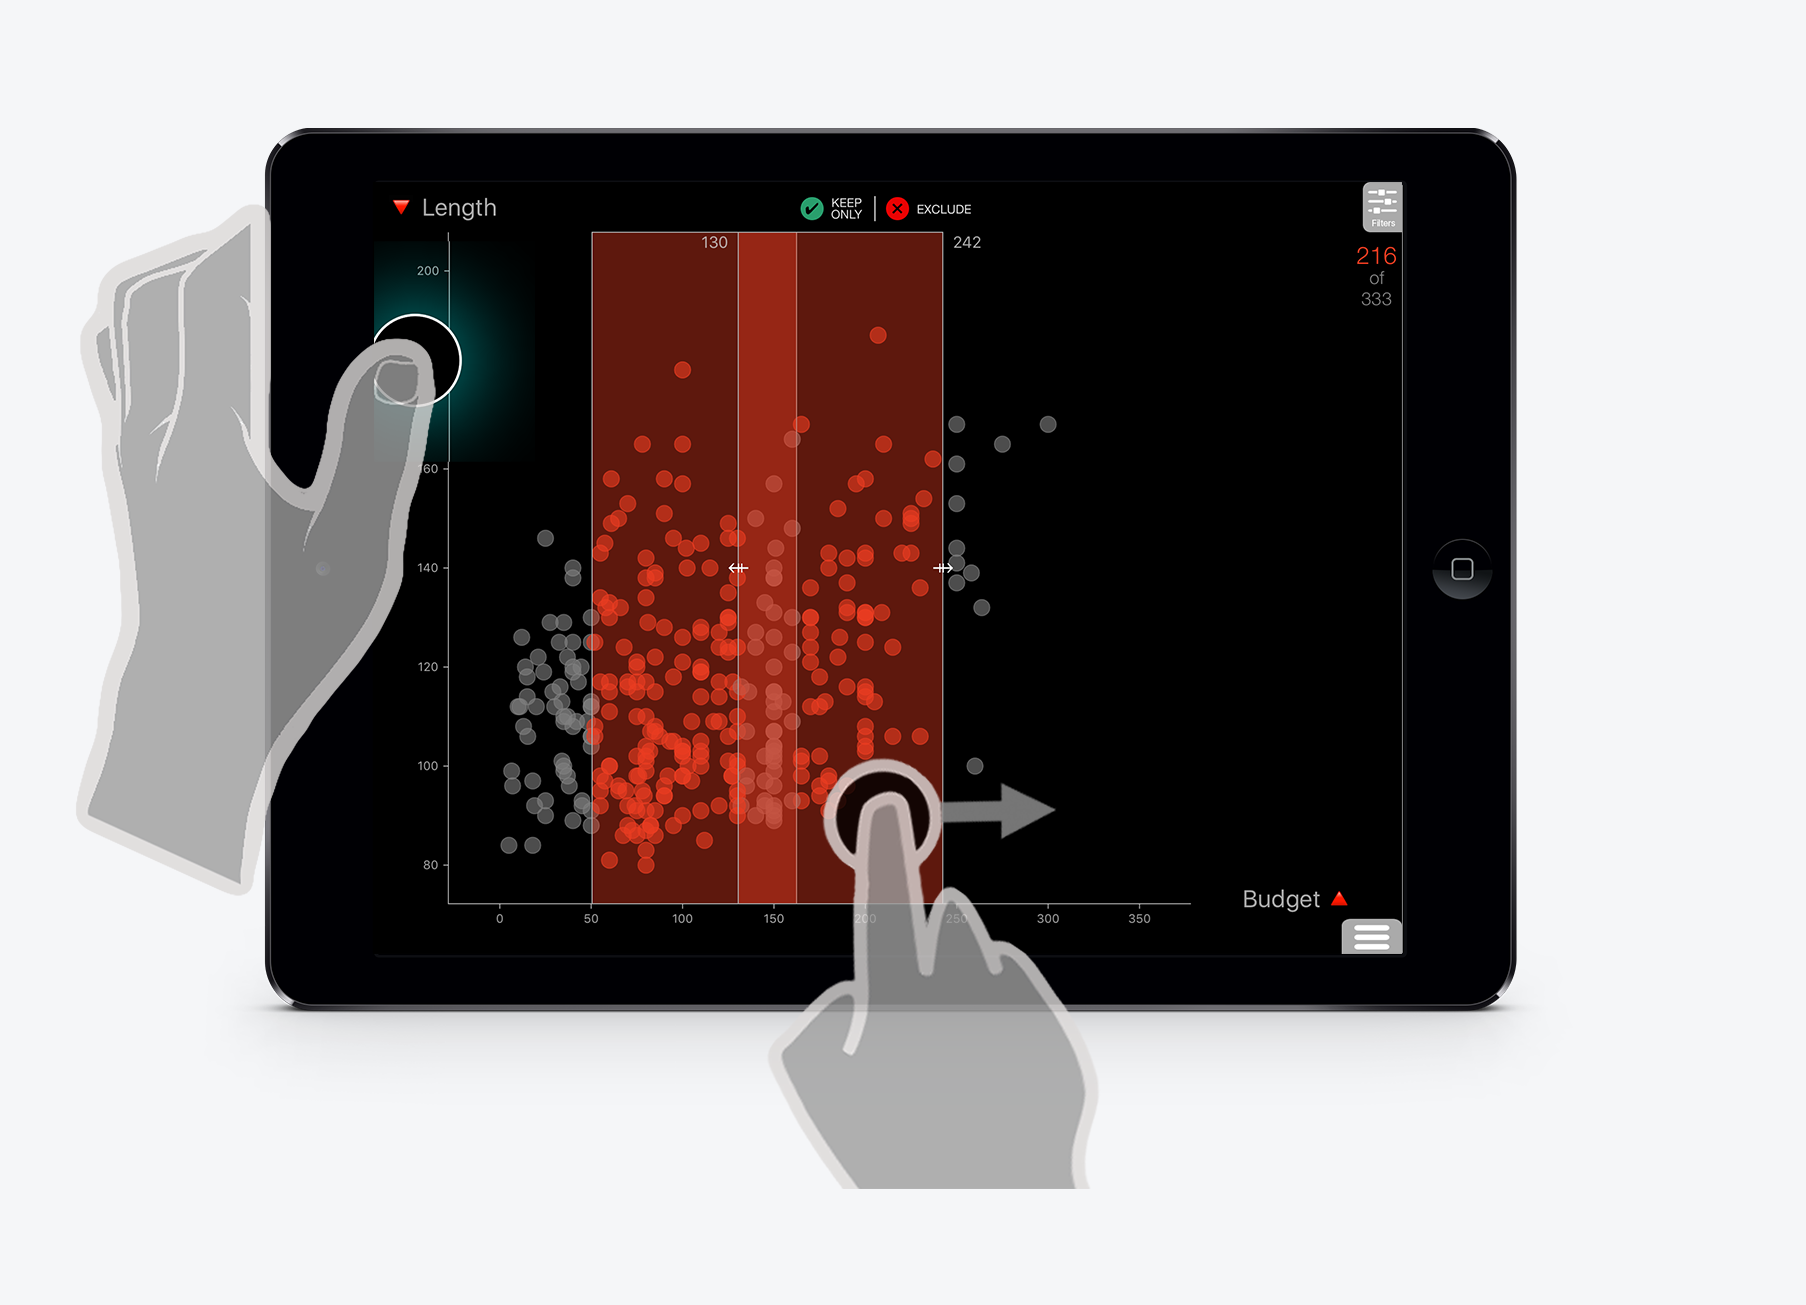
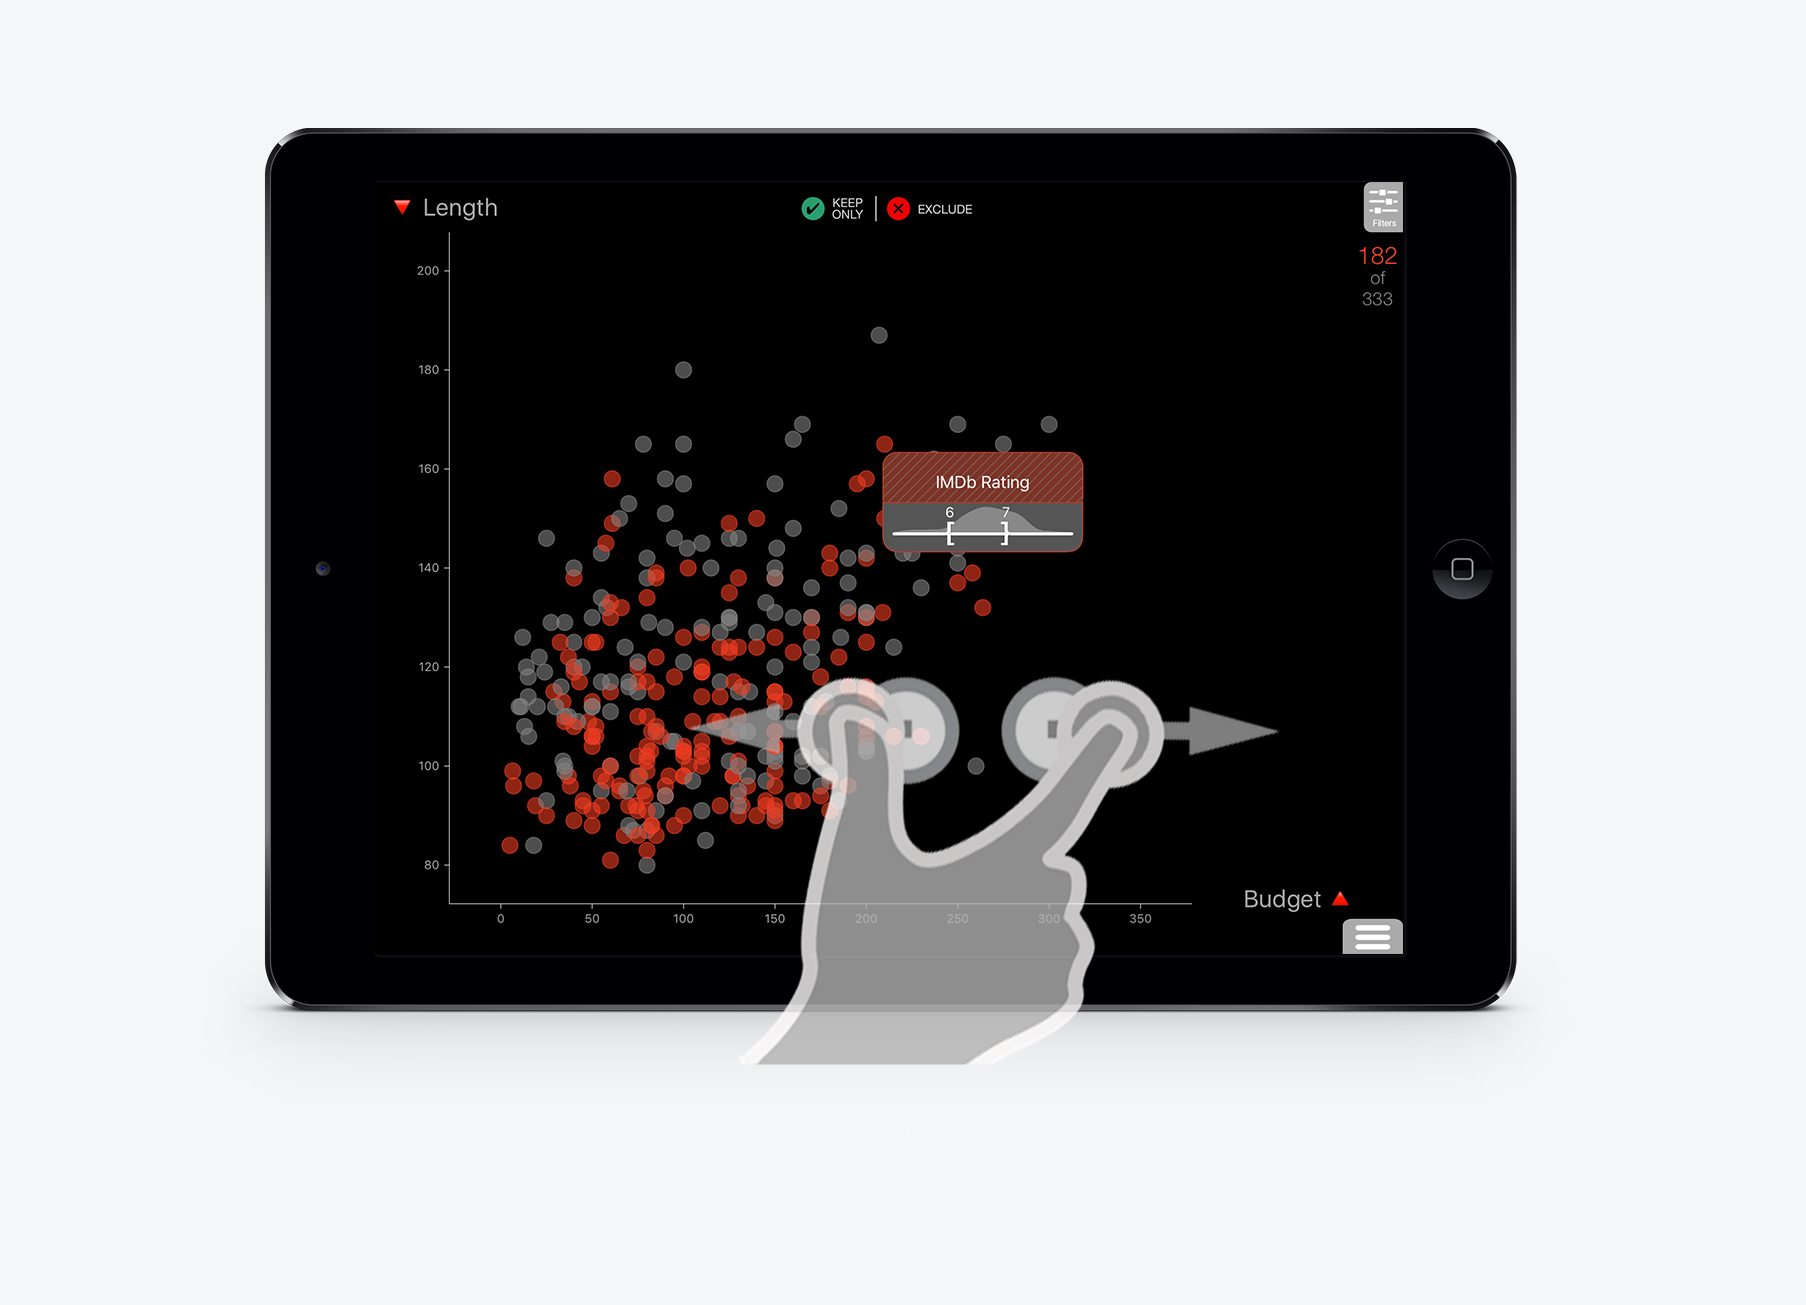
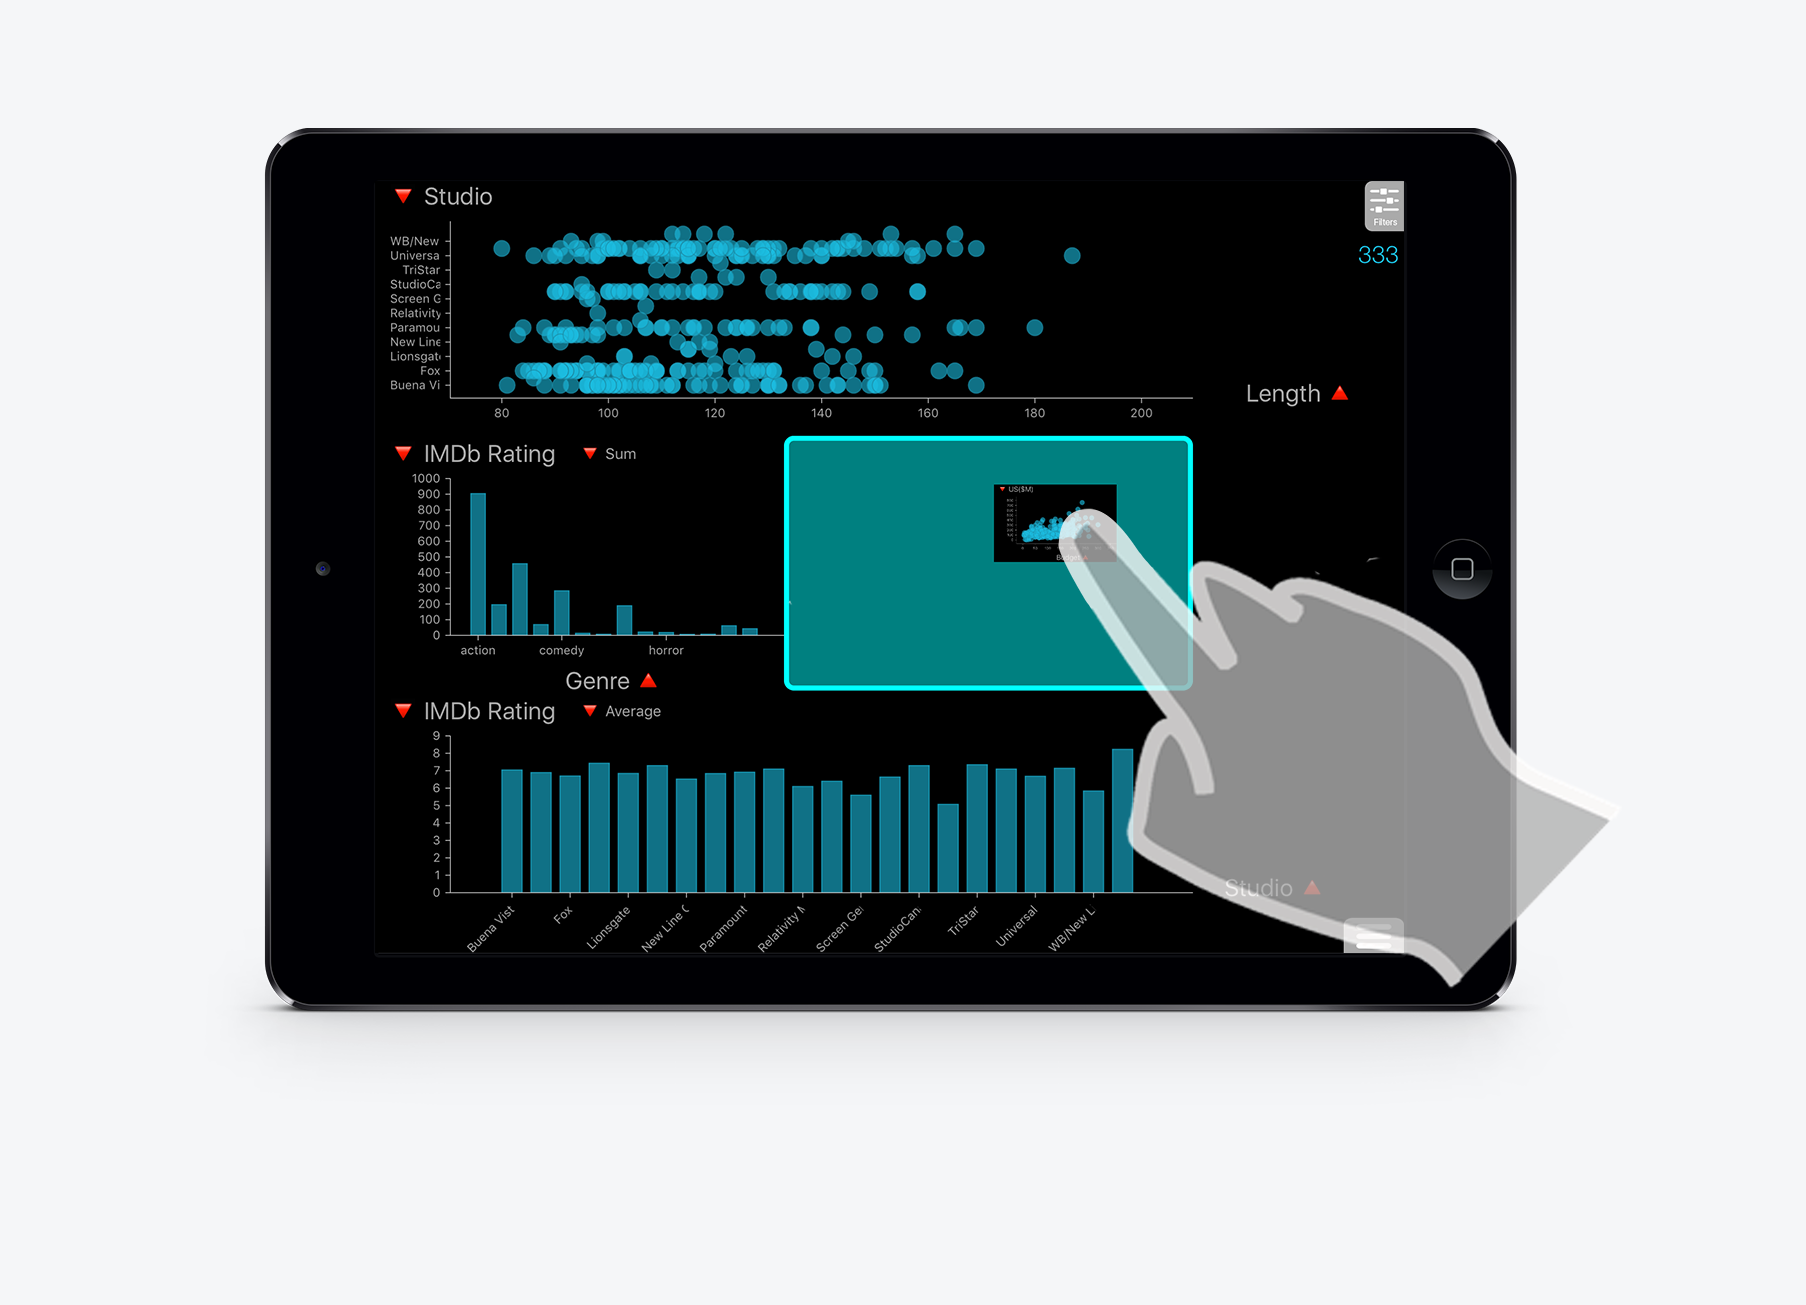
In my doctoral work, I addressed these questions and others. My research resulted in Tangere, an application for visualizing and analyzing tabular datasets on hand-held touch-based devices.
The Tangere System
Building Tangere
I built the system in three phases, each attempting to answer a specific research question. These were:
  1. Can an interactive visualization technique be effectively adapted to tablets?
  2. How does the experience scale to other visualization techniques?
  3. How can advanced analytical capabilities of desktop-class visualization systems be replicated on tablets?
System Snapshots
The first visualization technique I added to the system was Scatterplot.
The technique supported a wide range of interactive operations such as selection, zooming, filtering, and viewing details-on-demand, among others.
The challenge here was designing the interactions for the operations. I prototyped a range of choices and evaluated them to identify the most appropriate option.
Subsequently I extended support for other techniques, including Barchart and Linechart.
I also added Parallel Coordinates, which introduced the complexity of an entirely different set of interactions and operations.
Multiple techniques could appear in a coordinated configuration and support brushing & linking.
I added support for the Clutch gesture to enable advanced selection modes on the techniques, such as add-to-selection and duplicate selection.
Generalized Selection was also introduced to enable queries of the form 'Select others like this'.
Finally, I instrumented methods to modify the layout of views added to the screen.
Publications
TouchViz: A Case Study Comparing Two Interfaces for Data Analytics on Tablets
Steven M. Drucker, Danyel Fisher, Ramik Sadana, Jessica Herron, m. c. schraefel
CHI'13, Paris, France, April 2013
Designing and Implementing an Interactive Scatterplot Visualization for a Tablet Computer
Ramik Sadana and John Stasko
AVI’14, Como, Italy, May 2014
Designing Multiple Coordinated Visualizations for Tablets
Ramik Sadana and John Stasko
Eurovis’16, Groningen, Netherlands, June 2016
Expanding Selection for Information Visualization Systems on Tablet Devices
Ramik Sadana and John Stasko
ISS’16, Niagara Falls, Canada, Nov. 2016
Talk